The July WASDE report delivered some surprises. USDA’s ending stocks projection of 2.097 billion bushels for corn was much lower than markets expected and outside the lower end of the trading range. At this level, ending stocks still would be the highest since 2018/19.
USDA’s estimate for all-wheat production, meanwhile, was outside the upper end of the trading range at more than 2 billion bushels. If realized, this would be the highest level of U.S. all-wheat production since 2016/17.
Markets expected USDA to slightly lower its June estimate for soybean production. At 4.435 billion bushels, the estimate was on the high side of the trading range. Ending stocks for both the 2023/24 and 2024/25 soybean crops were below the average pre-report expectation.
The table below provides a snapshot of pre-report expectations for both old crop (2023/24) and new crop (2024/25) corn, soybeans and wheat.
| 2024/25 Yields (July WASDE & Pre-Report) |
| 2024 July WASDE | Average | Range |
| Corn | 181.0 | 180.7 | 179.5 - 181.0 |
| Soybeans | 52.0 | 51.9 | 51.0 - 52.0 |
| 2024/25 Production (July WASDE & Pre-Report) |
| 2024/25 Pre-Report Production Estimates (Million Bushels) |
| 2024 July WASDE | Average | Range |
| Corn | 15,100 | 15,060 | 14,857 - 15,232 |
| Soybeans | 4,435 | 4,416 | 4,335 - 4,435 |
| Wheat (All) | 2,008 | 1,913 | 1,865 - 1,999 |
| 2024/25 Ending Stocks (July WASDE & Pre-Report) |
| 2024/25 Pre-Report Ending Stocks Estimates (Million Bushels) |
| 2024 July WASDE | Average | Range |
| Corn | 2,097 | 2,272 | 2,124 - 2,498 |
| Soybeans | 435 | 445 | 350 - 507 |
| Wheat (All) | 856 | 793 | 750 - 863 |
| 2024/25 World Ending Stocks (June WASDE vs. Pre-Report) |
| 2024/25 Pre-Report World Ending Stock Estimates (Million Metric Tons) |
| 2024 July WASDE | Average | Range |
| Corn | 311.64 | 312.0 | 309.7 - 315.0 |
| Soybeans | 127.76 | 127.1 | 125.5 - 128.1 |
| Wheat (All) | 257.24 | 252.6 | 250.0 - 256.0 |
*Red = July WASDE above "Pre-Report Avg";
Green = July WASDE below "Pre-Report Avg"
Source: USDA |
| 2023/24 Ending Stocks (July WASDE & Pre-Report) |
| 2023/24 Pre-Report Ending Stocks Estimates (Million Bushels) |
| 2024 July WASDE | Average | Range |
| Corn | 1,877 | 2,041 | 1,917 - 2,126 |
| Soybeans | 345 | 353 | 329 - 377 |
| Wheat (All) | 702 | 698 | 680 - 708 |
| 2023/24 World Ending Stocks (July WASDE vs. Pre-Report) |
| 2023/24 Pre-Report World Ending Stock Estimates (Million Metric Tons) |
| 2024 July WASDE | Average | Range |
| Corn | 309.13 | 312.0 | 308.5 - 314.3 |
| Soybeans | 111.25 | 110.9 | 109.1 - 112.5 |
| Wheat (All) | 260.99 | 259.9 | 259.0 - 260.4 |
| 2023/24 Brazil Corn and Soy Production (July WASDE vs. Pre-Report) |
| 2023/24 Pre-Report Production Estimates (Million Metric Tons) |
| 2024 July WASDE | Average | Range |
| Corn | 122.0 | 121.3 | 120.0 - 122.0 |
| Soybeans | 153.0 | 152.1 | 149.0 - 153.0 |
| 2023/24 Argentina Corn and Soy Production (July WASDE vs. Pre-Report) |
| 2023/24 Pre-Report Production Estimates (Million Metric Tons) |
| 2024 July WASDE | Average | Range |
| Corn | 52.0 | 51.4 | 48.0 - 53.0 |
| Soybeans | 49.5 | 50 | 49.5 - 50.0 |
*Red = July WASDE above "Pre-Report Avg";
Green = July WASDE below "Pre-Report Avg"
Source: USDA |
Overall, the July WASDE was bullish for corn, neutral for soybeans and bearish for wheat. Below is a deeper dive into USDA’s projections, as well as a look at stored grain and the tough decisions ahead.
Corn Outlook: Larger Supplies, Use and Exports, Lower Ending Stocks
USDA lowered beginning stocks by 145 million bushels for marketing year 2024/25. This was due to increased 2023/24 usage, including an additional 75 million bushels for feed and residual use, and exports, also estimated to be an additional 75 million bushels.
As expected, 2024 corn yields remained at 181 bushels per acre. However, production projections rose 240 million bushels to 15.1 billion bushels, following the June acreage report, which increased plantings up to 91.5 million acres. The 2024 corn crop would be the third largest on record if USDA projections are realized and would come on the heels of 2023’s record harvest.
The season average farm price for 2024/25 was lowered $0.10 to $4.30 per bushel, the lowest price since 2019/20 and near the 10-year average of $4.29 per bushel.
Increased supply and lower expected prices led to adjustments to the 2024/25 balance sheet. Feed and residual use increased 75 million bushels and exports 25 million bushels.
With use rising more than supply, USDA adjusted 2024/25 ending stocks by 5 million bushels. However, ending stocks are still projected to be about 2.1 billion bushels, the highest since 2018/19 and more than 17% above the ten-year average.
The 2024/25 stocks-to-use ratio of 14.1% was down slightly from June’s estimate of 14.2%. If realized, the ratio would be 3.3 percentage points above the 5-year average.
Soybean Outlook: Lower Stocks and Production
USDA’s production estimate of 4.4 billion bushels of soybeans was down 15 million bushels due to the June acreage report, which reduced harvested area from 85.6 million acres to 85.3 million. At this level, the 2024 soybean crop would be the second largest in U.S. history. As expected, USDA made no change to the soybean yield of 52 bushels per acre. USDA also left soybean use unchanged for marketing year 2024/25.
Ending stocks were lowered 20 million bushels to 435 million bushels. This was due to reduced production, as slightly smaller beginning stocks. Despite the reduction, ending stocks would be at their highest since 2019/20 and 18% above the 10-year average.
The 2024/25 stocks-to-use ratio was trimmed from 10.4% in June to about 10%, the highest since 2019/20 and approximately two percentage points above the five-year average.
USDA lowered the season-average soybean price for 2024/25 by $0.10 per bushel to $11.10 per bushel. If realized, this price would be $0.53 per bushel higher than the 10-year average.
On the global balance sheet, 2024/25 beginning stocks increased 0.18 million metric tons; a 3 million metric ton increase in stocks for China offset lower stocks for Argentina, Brazil and Paraguay. Counter to pre-report expectations, USDA lowered 2023/24 Argentinian soybean production 0.5 million metric tons based on data from Argentina’s Ministry of Agriculture, Livestock, and Fisheries. As expected, USDA left 2023/24 Brazilian soybean production unchanged.
Global ending stocks for 2024/25 fell 0.1 million metric tons from June to 127.8 million metric tons. The world stocks-to-use ratio, however, remains abundant at 31.5%, nearly 4 percentage points above the 10-year average.
Wheat Outlook: Larger Supplies, Use, Exports and Stocks
The first 2024 survey-based production forecasts for other spring wheat and Durum indicated an increase of 578 million bushels and 89 bushels, respectively, compared to last year. Winter wheat production was forecast higher at 1.34 billion bushels. If realized, USDA’s all-wheat production of more than 2 billion bushels for marketing year 2024/25 would be the highest since 2016/17.
USDA revised total wheat usage up 35 million bushels since June to 1.959 billion bushels. Exports accounted for 25 million of the additional bushels and feed and residual, 10 million bushels. At 825 million bushels, exports would be the highest in four years. Projected 2024/25 ending stocks increased 98 million bushels to 856 million, up 22% from last year and the highest in five years.
USDA lowered the projected 2024/25 season-average farm price $0.80 to $5.70 per bushel due to higher stocks, lower futures and cash prices and lower projected corn prices.
Globally, the wheat outlook for 2024/25 is for larger supplies, consumption, trade and stocks. Global supplies increased 6.9 million metric tons to more than 1,057 million. This is due to larger beginning stocks from the U.S., China, U.K. and Brazil and higher production from the U.S., Pakistan and Canada.
Global trade was nearly unchanged at 212.9 million metric tons. Higher exports from the U.S., Canada and Pakistan were offset by reductions from the E.U., Turkey, and Uzbekistan. Projected global ending stocks for wheat in 2024/25 increased 5 million metric tons to 257.2 million metric tons, while stocks-to-use ratio for wheat remains tight at 32.2%, more than 3.5 percentage points below the 10-year average.
Storage and Basis Analysis
Corn stocks in all positions as of June 1, 2024, totaled 4.99 billion bushels, up 22% from last year, according to USDA’s grain stocks report. Soybean stocks in all positions totaled 970 million bushels, also up 22% from last year. This means producers continue to store 2023 corn and soybean stock, despite higher carry cost from lower commodity prices and higher interest rates.
More than 3 billion bushels were stored on farms, up 37% from a year ago and the highest since 1988. On-farm stocks for soybeans totaled 466 million bushels, up 44% from a year ago and the highest since 2020. Figures 1 through 4 show on-farm corn and soybean stocks as of June 1, 2024, and compares that level against the average over the past ten years (since 2014) for each state. U.S. corn and soybean stocks stored on farms as of June 1, 2024, are 25% and 30%, respectively, above their ten-year average.
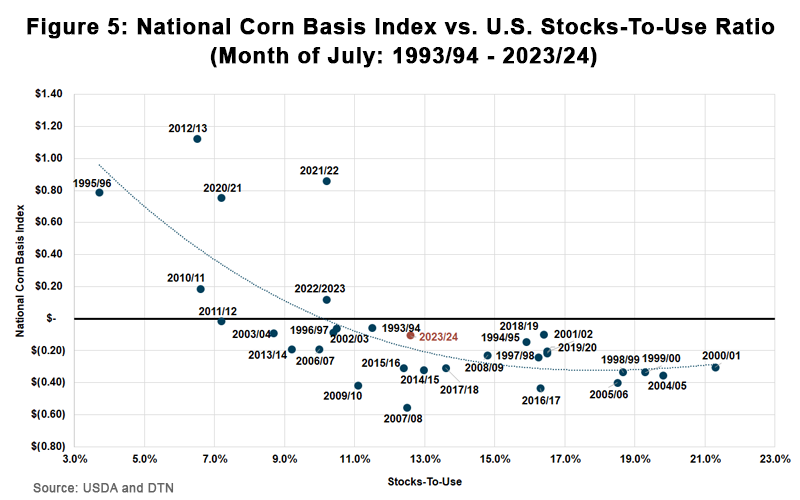
The stocks-to-use ratio for the 2023/24 corn crop is 12.6% and corn basis through July 8, 2024, has remained relatively narrow. Producers holding onto grain is one explanation. While basis is influenced by many economic variables, large domestic stocks-to-use ratios historically favor wider basis levels, as shown in Figure 5.
Farmers with stored grain are in a delicate situation. Nearby corn and soybean futures have dropped 14% and 9%, respectively, since the beginning of the year, and the influx of new crop at harvest could put further downward pressure on commodity prices. On the other hand, buyers still need sufficient supplies to meet demand.
Producers need to be mindful of the risks that stored grain puts on their cash flow and operating credit. Old crop corn and soybeans lose value in the bin not only because of decreasing corn and soybean futures but also because basis is wider compared to the past few years and higher cost of carry.
While markets can adjust and bring upside opportunities, it is important to understand how 2023 inventory can impact cash flows and working capital positions in 2024 and even 2025.
